![]()
![]()
![]()

And also, but why would you:
![]()
TermPlot
Utility and library to plot graphs in a terminal window. Uses ANSI colors and UTF-8 display characters.
Inspiration/Motivation
I spend a decent chunk of my time coding for headless/terminal based projects. Most of the time, when working with server processes or long running CLI programs, the output is a long text, more often than not without any color.
Now, granted, you can plug a web interface somewhere in the mix and get some colors and some graphs, but something in me rebels at the ideal of using 200+ megabytes of RAM just to monitor something.
I experimented with ANSI colors in SwiftLogger, and for a while it was sufficient. But when you use htop, or iotop, or the other cool looking terminal based monitoring tools out there, it's easy to see that lines and lines of text aren't enough.
When I looked around to see if something similar existed for swift I came across termplot for ruby and it was exactly what I wanted. At first, I tried to port it straight, but ruby and swift are very different languages with very different idiosyncrasies, so it diverged very quickly. And it took unexpected directions along the way.
The executable
OVERVIEW: Utility to plot graphs in a terminal window. Uses ANSI colors and UTF-8 display characters.
If no color scheme or style is configured, will use line/light_red as a default
List of available colors:
black, light_black, red, light_red, green, light_green, yellow, light_yellow, blue, light_blue, magenta, light_magenta, cyan, light_cyan, white,
light_white, default
USAGE: term-plot [--presentation] [--demo] [--multi] [--text] [--file <file>] [--m-color <m-color>] [--q-colors <q-colors>] [--p-colors <p-colors>] [--style <style>] [--live]
OPTIONS:
--presentation Runs the animation presentation
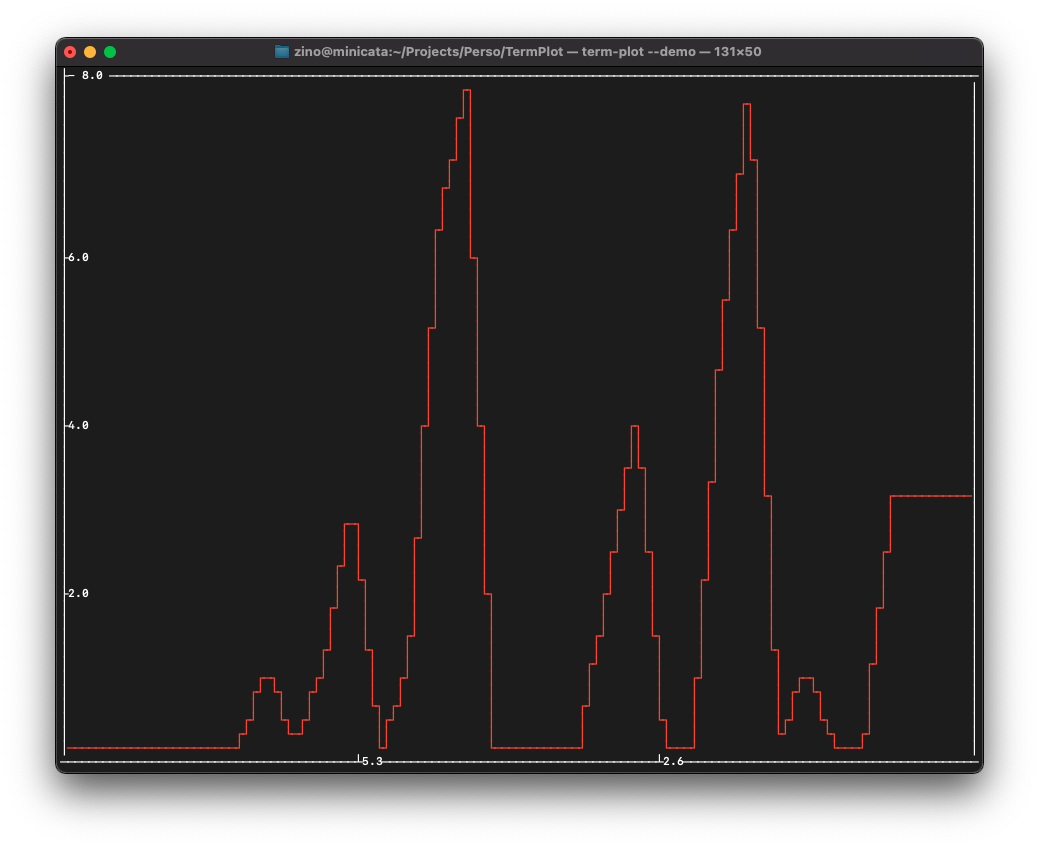
--demo Runs the demo
--multi Runs the multiple windows demo
--text Runs the text demo
-f, --file <file> The file to read from. If absent, will read from standard input
-m, --m-color <m-color> Monochrome color to use (default: light_red). Mutually exclusive with other color options
-q, --q-colors <q-colors>
Quarter colors to use (default: green,blue,yellow,red). Mutually exclusive with other color options
-p, --p-colors <p-colors>
Percent quartile colors to use (default: green,blue,yellow,red). Mutually exclusive with other color options
-s, --style <style> Style of the graph (supported values: block, dot, line)
--live Should continue monitoring input for changes. By default, the program does not update anymore at the EOF
--version Show the version.
-h, --help Show help information.
Most of the options are self-explanatory:
-fwill read from a file rather thanstdin--livewill continously update, rather than stop at the current end of data- the 3 color styles can allow for a sometimes more legible output:
- monochrome (default): simple colors scheme where everything is the same color
- quarters: the height is divided in 4, one color per quarter
- percentage quartiles: the values are divided in 4 ranges, one color per quarter. Being in the highest bracket color means the value is greater than 75% of all the values in the buffer
- similarly the 3 display styles allow for fflexibility:
block: "histogram" style, or "area" style. The values under the current one are colored, everything above is notline: straight up line showing the datadots: less convincing (to me) but has its uses. A dot is put in at the correct height for each column.
The --demo, --multi, --text, and --presentation are non-interactive showcases, because I like whimsy.
The library
Because I will be using this in other projects, I need it to exist as a library I can load. The executable is essentially a demo to show how to use the library.
More information (⚠️ dev-heavy stuff ⚠️) can be found in the Documentation
The main classes/concepts are as follows:
TermUtils / TermHandler
(crowd chanting booh, booh anti-pattern!)
Singleton used for window and cursor manipulation. This is where most of the lowest behaviors and functions live, such as moving the cursor around or setting styles
TermWindow
Base class that exposes the utilities found in TermHandler, and sets up / restores the TTY when the program actually runs. It is also home to the mechanic used in the other implementations: the request then blit of the buffer, through requestBuffer/requestStyledBuffer and draw.
I decided to go this route rather than direct-access, because of the way my brain works, but your mileage may vary, obviously.
TermMultiWindow
Variant of a TermWindow that handles composition with stacks. A list of sub windows, and their respective ratios, is all that's needed.
StandardSeriesWindow
Base class for graphical plot output and first truly "usable" class, very straightforward: a series of values, with 1-increments along the X axis. Because most of the graphs I need are time based, and looking at the past, this implementation does not allow for gaps or stretches on the horizontal scale.
TimeSeriesWindow
Tick-based variant there every timeTick seconds, a block of code is called to determine what the next value is. Useful for library mode where the data might have to be transformed before being graphed.
LiveSeriesWindow
Live variant where changes in the input determine the frequency at which the graph updates. Think of it as passing the responsibility of the clock to the program/process that generates the data.
TextWindow
Text area that will do its best to approximate colors and styles of a NSAttributedString buffer.
GitHub
| link |
| Stars: 2 |
| Last commit: 3 years ago |
Dependencies
Release Notes
Seeing all this cool ANSI colors and being frustrated about outputting text with colors and styles? Fret not. 🙃

Swiftpack is being maintained by Petr Pavlik | @ptrpavlik | @swiftpackco | API | Analytics