BIKCharts
BIKCharts is a new chart framework for iOS +13. There are different types of Charts like BarChart, LineChart, PieChart. There are lots of configurable options for these charts.
Tip: All chart models are ObservableObject and these properties have publisher. So you can easily change your model dynamically.
- Pure SwiftUI
- Dynamic
- Animatable
- Tooltip support
- Configurable
- Easy to implement and use
Requirement
- iOS +13
Installation
Use Swift Package Manager and add package dependency (File > Swift Packages > Add Package Dependency...) https://github.com/ilyadaberdil/BIKCharts.git
Usage
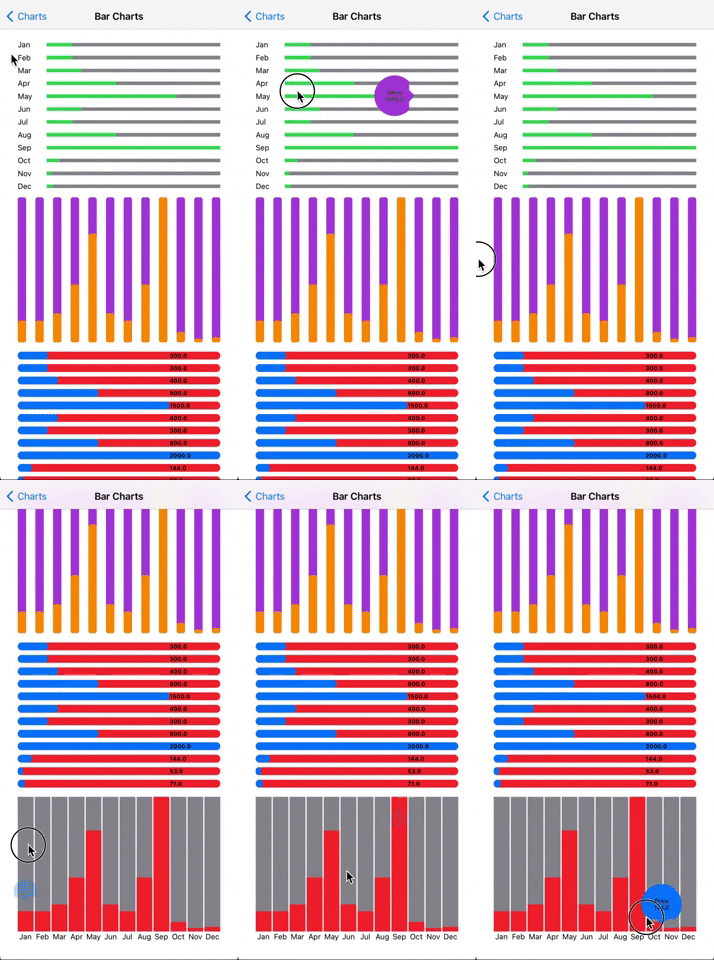
BarCharts
Create BarChartModel to configure your charts.(Some of these properties have default value but you can configure as you wish)
// Sample titles and values for BarChartModel
let values: [CGFloat] = [300, 300, 400, 800, 1500, 400, 300, 800, 2000, 144, 53, 71]
let titles: [String] = ["Jan", "Feb", "Mar", "Apr", "May", "Jun", "Jul", "Aug", "Sep", "Oct", "Nov", "Dec"]

let model = BarChartModel(data: values,
                          dataDescriptions: titles,
                          calculationType: .maxValue,
                          barSpacing: 16,
                          fillBarColor: .green,
                          emptyBarColor: .gray,
                          barCornerRadius: .zero,
                          showValueText: false,
                          showValueDescription: true,
                          isBadgeViewEnabled: true,
                          badgeViewModel: BadgeValueModel(showUnderline: true,
                                                          underlineColor: .red,
                                                          title: "Value",
                                                          foregroundColor: .purple),
                          direction: .vertical)
That's all 🎉 If you want to implement your custom dragAction, you can use this callBack;
BarChart(with: model, dragAction: { (value) in
  print(value)
})
.frame(width: 350, height: 250)
Sample

LineChart
Create LineChartModel to configure your charts.(Some of these properties have default value but you can configure as you wish)
// Sample values for LineChartModel
let values: [CGFloat] = [300, 300, 400, 800, 1500, 400, 300, 800, 2000, 144, 53, 71]

let model = LineChartModel(data: values,
                           calculationStyle: .maxValue,
                           lineWidth: 2,
                           showPoints: true,
                           lineColor: .red,
                           pointColor: .gray,
                           fillWithLinearGradient: LinearGradient(gradient: Gradient(colors: [.red, .green, .purple]),
                                                                  startPoint: .bottom,
                                                                  endPoint: .top),
                           showLineWhenFilled: true,
                           dashOfLine: [10],
                           isBadgeViewEnabled: true,
                           badgeViewModel: BadgeValueModel(showUnderline: true,
                                                           underlineColor: .red,
                                                           title: "Value",
                                                           foregroundColor: .blue))
That's all 🎉 If you want to implement your custom dragAction, you can use this callBack;
LineChart(with: model, dragAction: { (value) in
  print(value)
})
.frame(height: 120)
Sample

PieChart
Create PieChartModel to configure your charts.(Some of these properties have default value but you can configure as you wish)
// Sample pieChartDataList for PieChartModel
  let pieChartDataList: [PieChartData] = [.init(slice: .init(value: 35, color: .red),
                                                              titleConfiguration: .init(title: "C",
                                                                                        foregroundColor: .black,
                                                                                        font: .headline)),
                                                        .init(slice: .init(value: 75, color: .green),
                                                              titleConfiguration: .init(title: "C++",
                                                                                        foregroundColor: .yellow,
                                                                                        font: .headline)),
                                                        .init(slice: .init(value: 55, color: .gray),
                                                              titleConfiguration: .init(title: "Java",
                                                                                        foregroundColor: .blue,
                                                                                        font: .headline)),
                                                        .init(slice: .init(value: 124, color: .orange),
                                                              titleConfiguration: .init(title: "Kotlin",
                                                                                        foregroundColor: .gray,
                                                                                        font: .headline)),
                                                        .init(slice: .init(value: 172, color: .blue),
                                                              titleConfiguration: .init(title: "Swift",
                                                                                        foregroundColor: .orange,
                                                                                 font: .headline))]

    let model = PieChartModel(data: pieChartDataList,
                                    borderStyle: BorderStyle(circumferenceBorderStrokeStyle: .init(lineWidth: 3,
                                                                                                   lineCap: .butt,
                                                                                                   lineJoin: .bevel,
                                                                                                   dash: [20]),
                                                             circumferenceBorderColor: .pink))
That's all 🎉 If you want to implement your custom tapAction, you can use this callBack;
PieChart(viewModel: model, tapAction: { (data) in
  print(data)
})
.frame(height: 250)
Sample

Author
Berdil İlyada Karacam [email protected] https://www.linkedin.com/in/ilyadaberdil
License
BIKCharts is available under the MIT license. See the LICENSE file for more info.
GitHub
| link |
| Stars: 9 |
| Last commit: 2 years ago |
Release Notes
Swiftpack is being maintained by Petr Pavlik | @ptrpavlik | @swiftpackco | API | Analytics